Overview
Learn what Kuma Mieru does and find where to start with deployment and configuration.
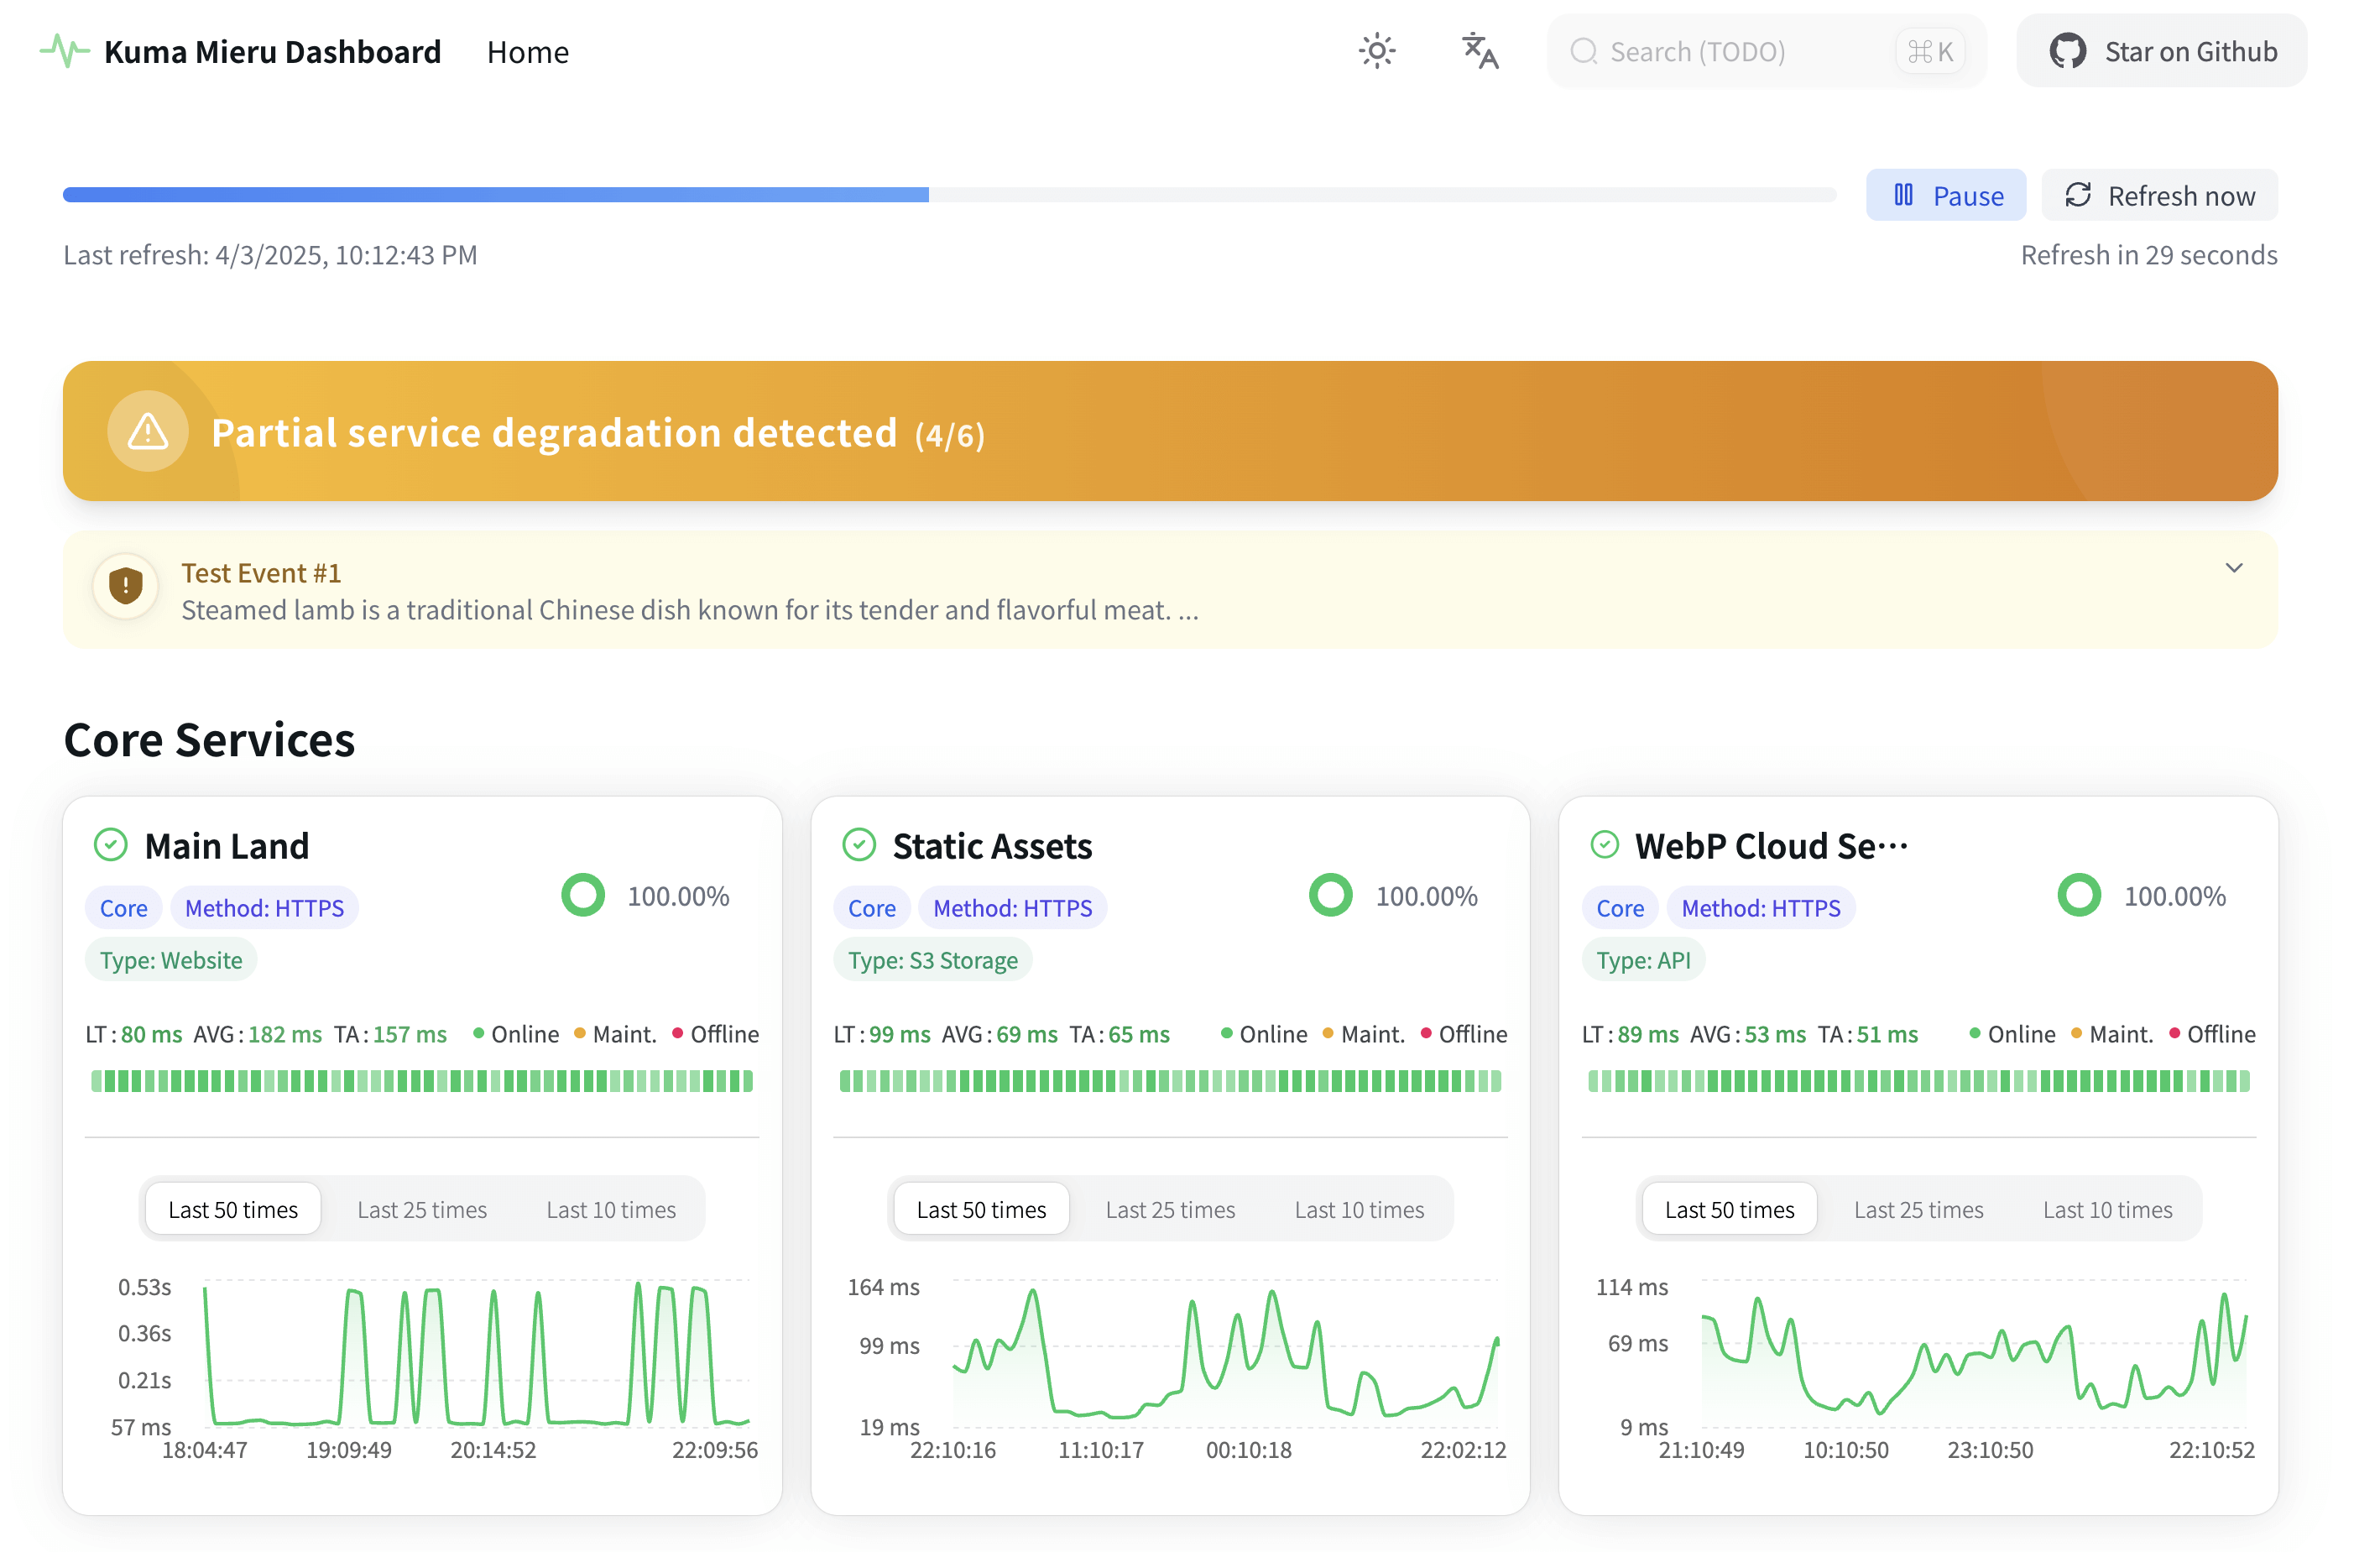
Kuma Mieru is a third-party monitoring dashboard for Uptime Kuma, built with Next.js 16, TypeScript and Recharts. It reads the data of Uptime Kuma public status pages and shows the latency and status of each monitor in interactive charts. The built-in public status page of Uptime Kuma has no latency charts and is hard to read at a glance. Kuma Mieru adds these charts and a clearer layout.
Set the Uptime Kuma display time zone to UTC+0
Version 1.1.4 and later use new time handling logic. In the Uptime Kuma settings, set Display Timezone to a UTC+0 time zone. For the reason, see the FAQ.
Features
- The status updates in real time, and the page refreshes automatically.
- The interface uses HeroUI components and fits screens of different sizes.
- Interactive Recharts charts show the latency and status of each node.
- Three themes are available: dark, light and system.
- The dashboard shows the incident updates and status events of the Uptime Kuma status page.
- One Kuma Mieru instance can show multiple status pages. The status pages can come from different Uptime Kuma instances.
Screenshots
Tech stack
| Purpose | Technology |
|---|---|
| Framework | Next.js 16, React 19 |
| Language | TypeScript |
| Charts | Recharts |
| Components and styles | HeroUI, Tailwind CSS v4 |
| Package manager | Bun |
Next steps
Choose a deployment method
Compare Vercel, Netlify, EdgeOne Pages, Docker and running from source.
Connect Uptime Kuma
Create a status page, set the display time zone and get the status page URL.
Environment variables
See all variables, their defaults and when a change takes effect.
FAQ
Fix time offsets, configuration changes that do not apply, iframe embedding and more.
Last updated on